What Are the Best Home Solar Systems in 2026?
Choosing the best home solar system in 2026 means looking beyond panel names and efficiency claims. The right setup depends on your roof, electricity use, local utility rates, and whether you need battery backup. A system that performs well in Arizona may offer less value on a shaded New England roof.
Industry figures show why careful comparison matters. The IEA PVPS Trends in Photovoltaic Applications 2024 report estimated that global solar installations exceeded 400 gigawatts in 2023. In the United States, SEIA and Wood Mackenzie reported 32.4 gigawatts of new solar capacity that year, including about 6.8 gigawatts in the residential market. That is real momentum. But volume alone does not identify the best system for a household. Buyers should compare usable energy production, equipment warranties, inverter design, battery compatibility, installer service, and the quoted price per watt. A high-efficiency panel can be useful when roof space is tight, while a reliable string-inverter system may suit a simpler roof at a lower cost. Batteries add resilience, but their value depends on outages, time-of-use rates, and export compensation.
There is no universal winner. Utility rules and installed prices vary by location, and published product tests cannot predict every roof’s output. This guide compares leading system types and brands using practical criteria, not a single headline specification. Treat rankings as a starting point, then confirm the design with site-specific production estimates and itemized quotes. Some estimates will still miss the mark. That deserves scrutiny.
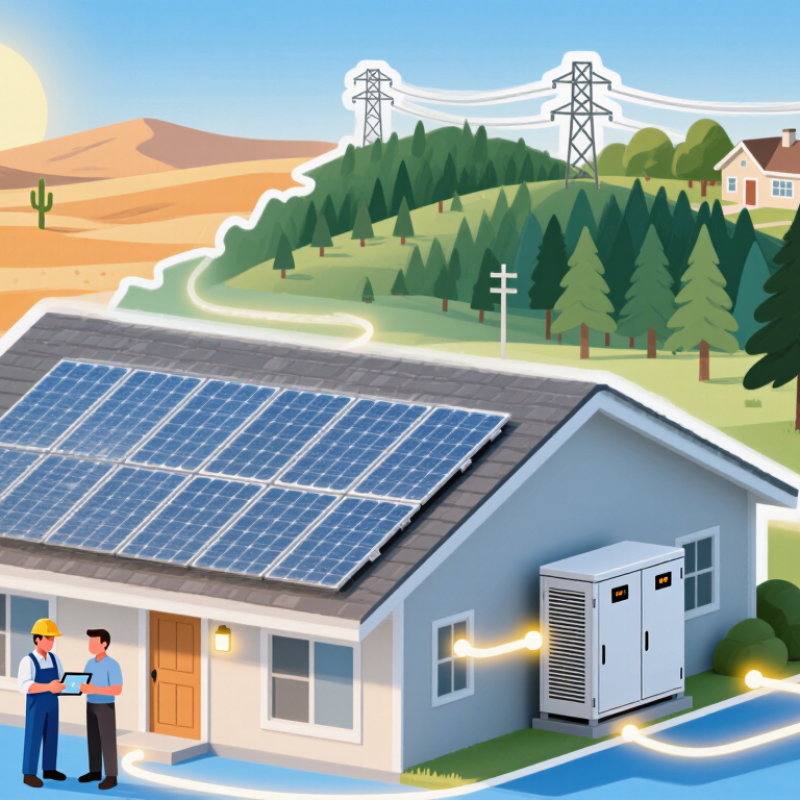
How Home Solar Works: PV Modules, Inverters, Batteries, and Grid Connections
A home solar system begins with photovoltaic (PV) modules on the roof. Sunlight creates direct-current electricity, which an inverter converts into alternating current for household circuits. The inverter also monitors output and shuts down during some grid outages unless the system has approved backup equipment.
Small detail, big consequence.
A battery stores surplus daytime electricity for evening use, but its usable energy and power rating determine which appliances it can support. A fridge and a few lights need less power than an electric range.
When production exceeds household demand, electricity may flow to the grid; after sunset, the home can draw power back. Export credits and interconnection requirements vary by utility, so a system’s value depends on local rules as well as panel output.
NREL’s review of photovoltaic field studies found a median module degradation rate near 0.5% per year. That is an average, not a promise for every roof. Shade from a chimney, dust, inverter losses, and seasonal daylight all affect actual production. A careful design uses a site-specific production estimate and checks the main electrical panel before installation. Even then, forecasts are estimates; real usage can be messier.
Compare Panel Efficiency Using NREL’s Best-Research-Cell Chart
What Are the Best Home Solar Systems in 2026?
The best home solar system depends on your roof, energy use, and budget—not a record cell alone. NREL’s Best-Research-Cell Chart is a useful reference for comparing laboratory cell efficiencies across technologies. It shows what researchers have achieved under controlled test conditions. It does not show the expected output of a complete rooftop system. A finished panel includes protective layers, wiring, and spacing, which affect performance. Heat and shade matter, too.
Useful, but limited. Treat the chart as a research benchmark, not a shopping list. A high-efficiency cell record does not guarantee that a panel will produce more energy on your roof. Compare panel-level efficiency and estimated annual production for your location. Check how a proposal accounts for roof direction, shade from nearby trees, and seasonal weather. Ask how system losses are estimated, and whether the assumptions are clear. Small details can change the forecast. I’d be cautious about any estimate that sounds exact; real roofs rarely behave like test conditions.
Tips: Use NREL’s chart to understand efficiency trends. Then compare system estimates using the same roof and energy-use assumptions. Ask for the expected output in kilowatt-hours, not just a record-setting percentage.
Estimate Energy Output with NREL PVWatts and Local Weather Data
A useful solar comparison starts with energy, not panel labels. NREL PVWatts estimates how much electricity a grid-connected system may produce at a specific location. Enter the planned system size, roof tilt, direction, and expected losses. A south-facing roof is not the only workable option. The local setting matters.
Check the calculator’s weather source and compare it with reliable local weather data when available. Long-term averages are more useful than one sunny week. Nearby weather stations can reveal cloudy seasons, heavy snowfall, or persistent haze. Still, a station several miles away may not match your roof. Small differences count.
Test several system sizes and orientations, then compare estimated monthly output with household bills. Look closely at winter production, not just the annual total. A shaded chimney or tall tree can reduce real output beyond a simple estimate. PVWatts is a planning tool, not a guarantee. I would treat its result as a starting point, and leave room for uncertainty; roof conditions are easy to underestimate. A site assessment can check shading, wiring, and roof layout before you rely on the numbers.
Assess Battery Backup Against NREL’s 85% Lithium-Ion Efficiency Benchmark
In 2026, a home solar system is only as useful as the energy it can deliver when the sun goes down. NREL’s 85% lithium-ion efficiency benchmark offers a practical reference for battery backup. In simple terms, about 85 kilowatt-hours return for every 100 kilowatt-hours stored. Treat it as a comparison point, not a promise for every installation.
Check what the efficiency figure includes. A battery-only rating may exclude inverter losses, temperature control, and standby power. Ask for the complete system’s round-trip efficiency and whether it is measured in direct or alternating current. Then compare usable capacity, not just the battery’s advertised size. A 10-kilowatt-hour unit may reserve some energy to protect battery life. During an outage, that reserve can matter. So can the power rating: running a refrigerator and a few lights is different from starting a well pump or heating equipment. Real homes are messy; a neat spreadsheet can miss a cloudy week.
Tips: Request test conditions and usable capacity in writing. Match the battery’s continuous output to essential appliances, and check backup performance during a simulated outage. If quotes use different measurement methods, ask for a common basis before comparing them.
Compare Installed Costs: EnergySage Reported $2.80 per Watt in 2024
What makes a home solar system “best” in 2026 depends on its installed cost, expected output, and fit with your roof. The EnergySage 2024 Solar & Storage Marketplace Report reported an average quoted residential price of $2.80 per watt. At that rate, a 7-kilowatt system would cost about $19,600 before incentives. That is a useful reference, not a guaranteed quote. Lawrence Berkeley National Laboratory’s Tracking the Sun 2024 report found a $3.1-per-watt median price for residential systems installed in 2023. Different samples and pricing methods help explain the gap.
A lower price is not automatically better. Compare the full installed quote, including panels, inverter, labor, permits, and any battery. Ask how the system’s estimated annual production was calculated; shade from one chimney can change the numbers. Equipment warranties matter, but so do workmanship coverage and clear service terms. The reports describe past market prices, not a promise about 2026. Local labor costs and roof conditions still matter.
Tips: Request at least three itemized quotes using the same system size. Compare price per watt and estimated yearly output. Check whether incentives are included or shown separately. Small details can shift the total.